Kosrae Cultural Use Analysis
Heatmap Viewer
Click the tabs to view different use types


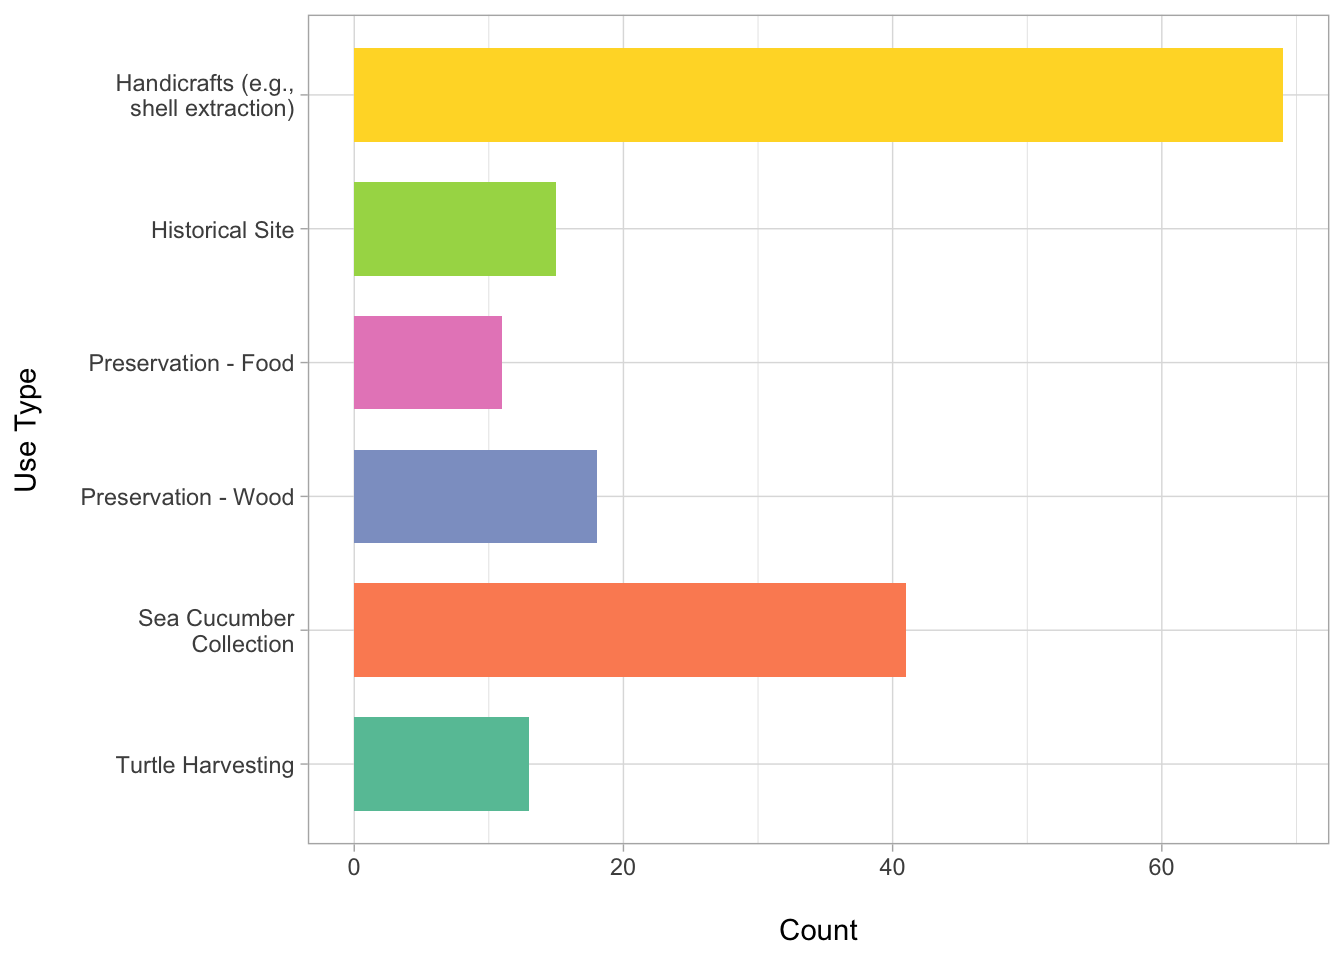
Number of Shapes
Number of shapes drawn in each use type
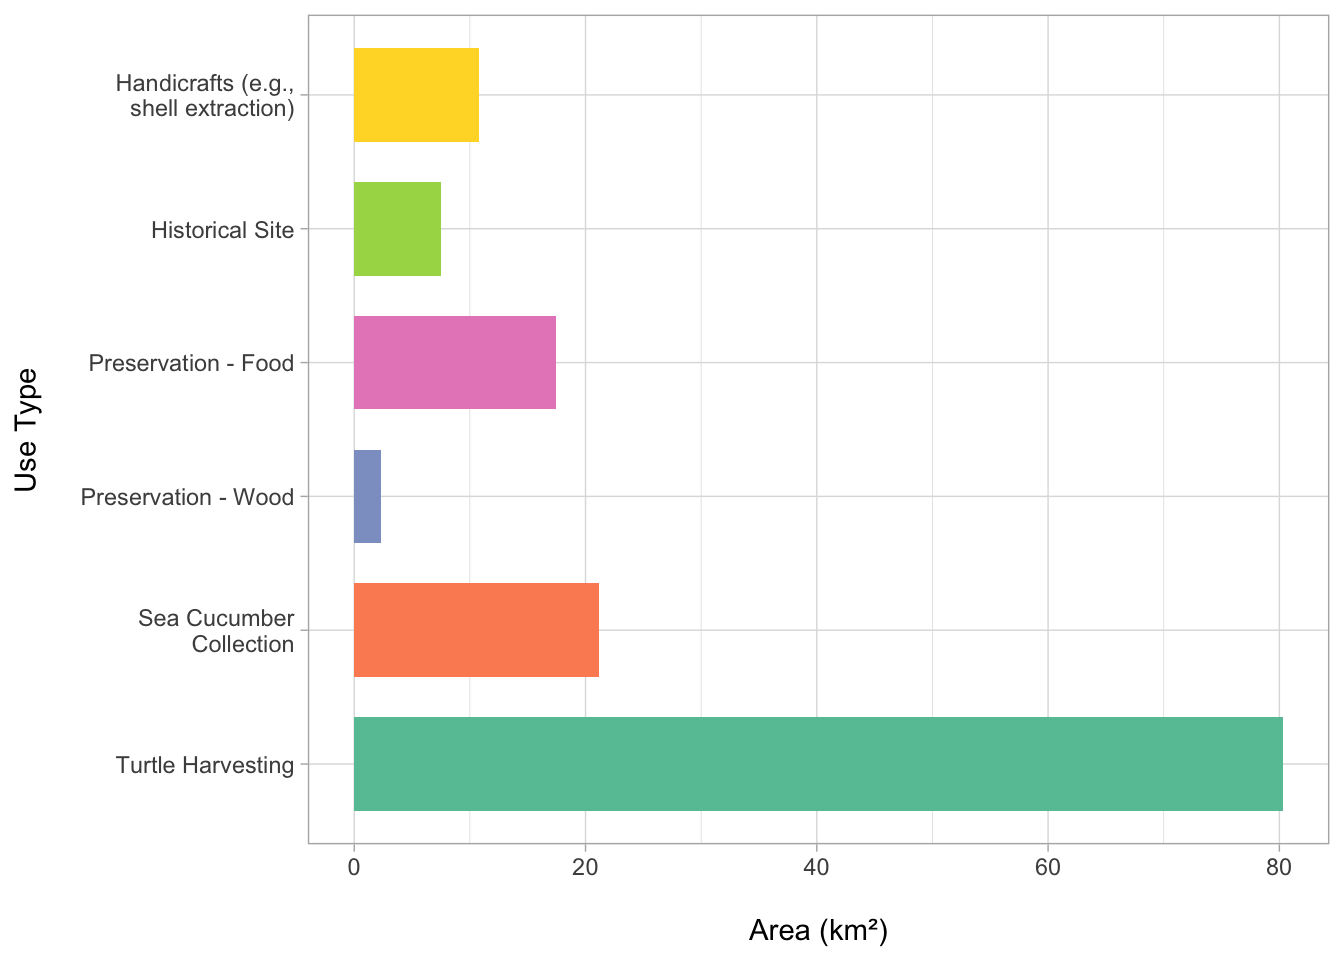
Area of Shapes
Total Area
Area of all shapes within use type regardless of overlap
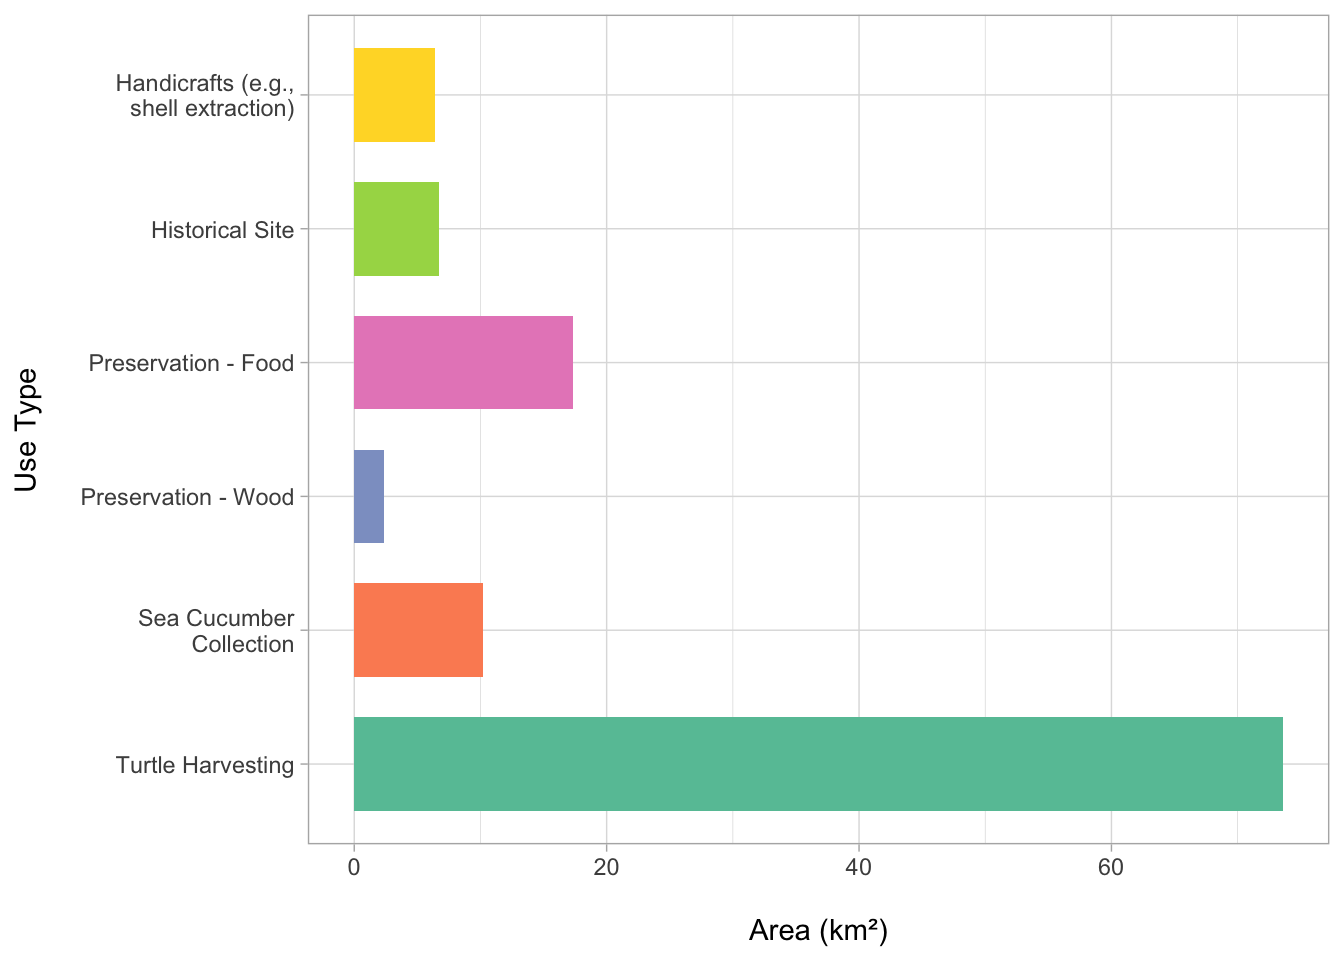
Geographic Area
Geographic coverage of shapes drawn - i.e. overlapping areas only counted once
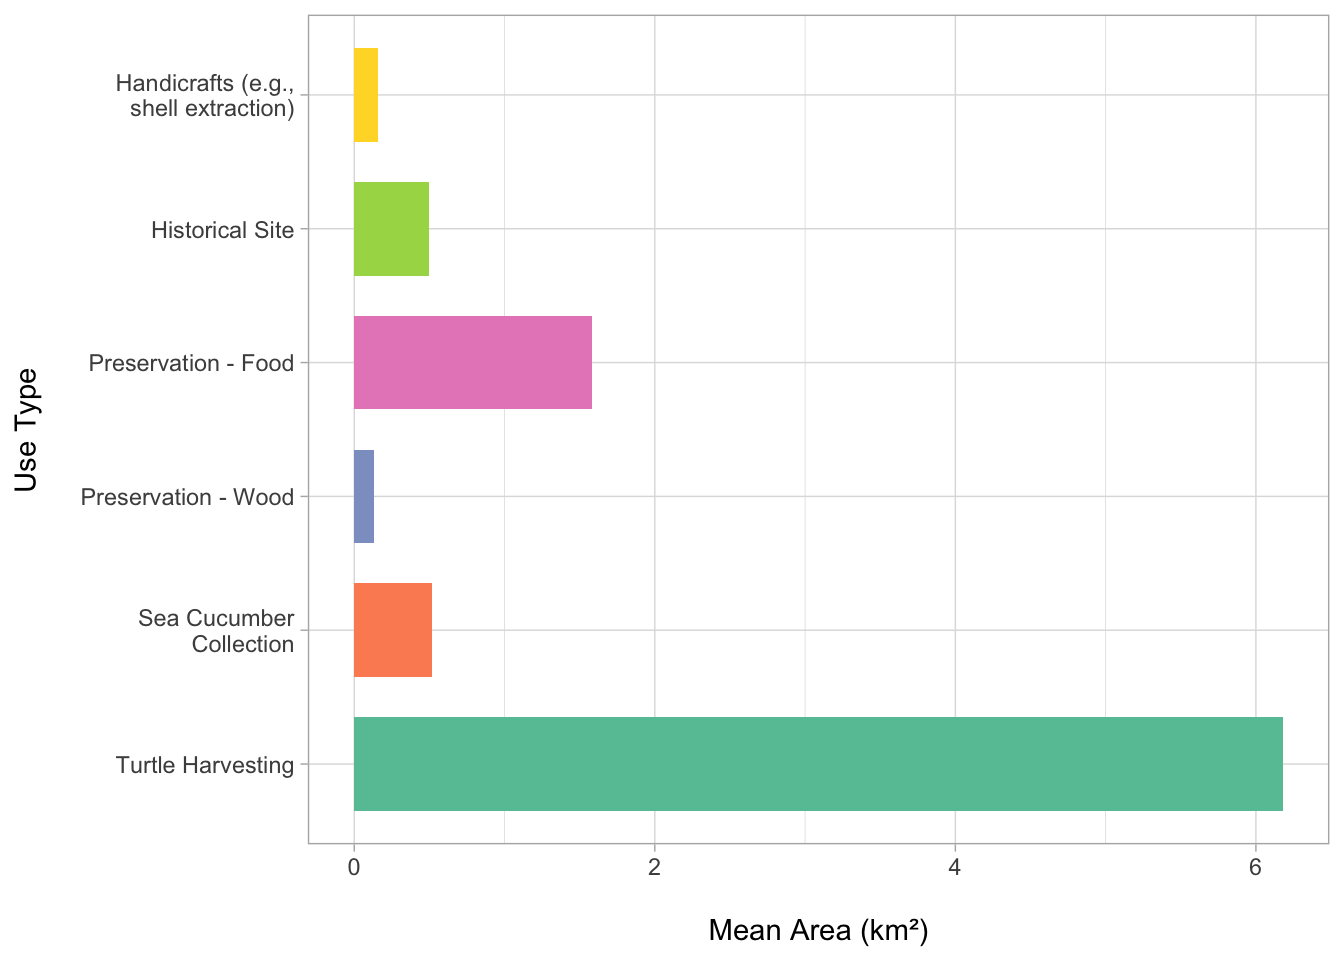
Mean Area
Mean area of shapes within use type
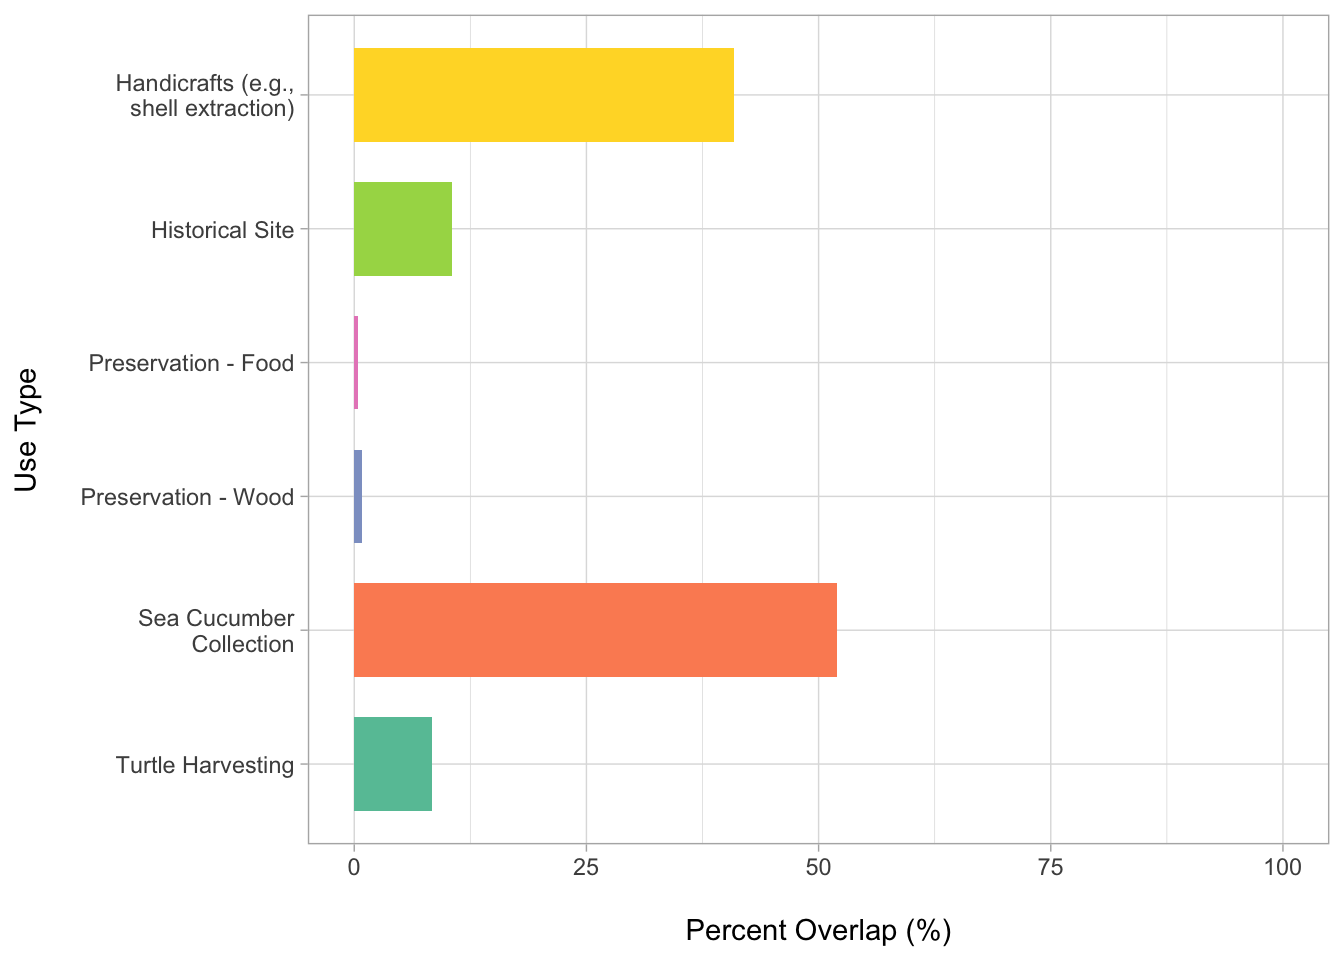
Percent Overlap
Geographic area divided by total area - i.e. percentage of total shape area that is overlapping
The lower the value, the more the individual shapes vary geographically - and vice versa
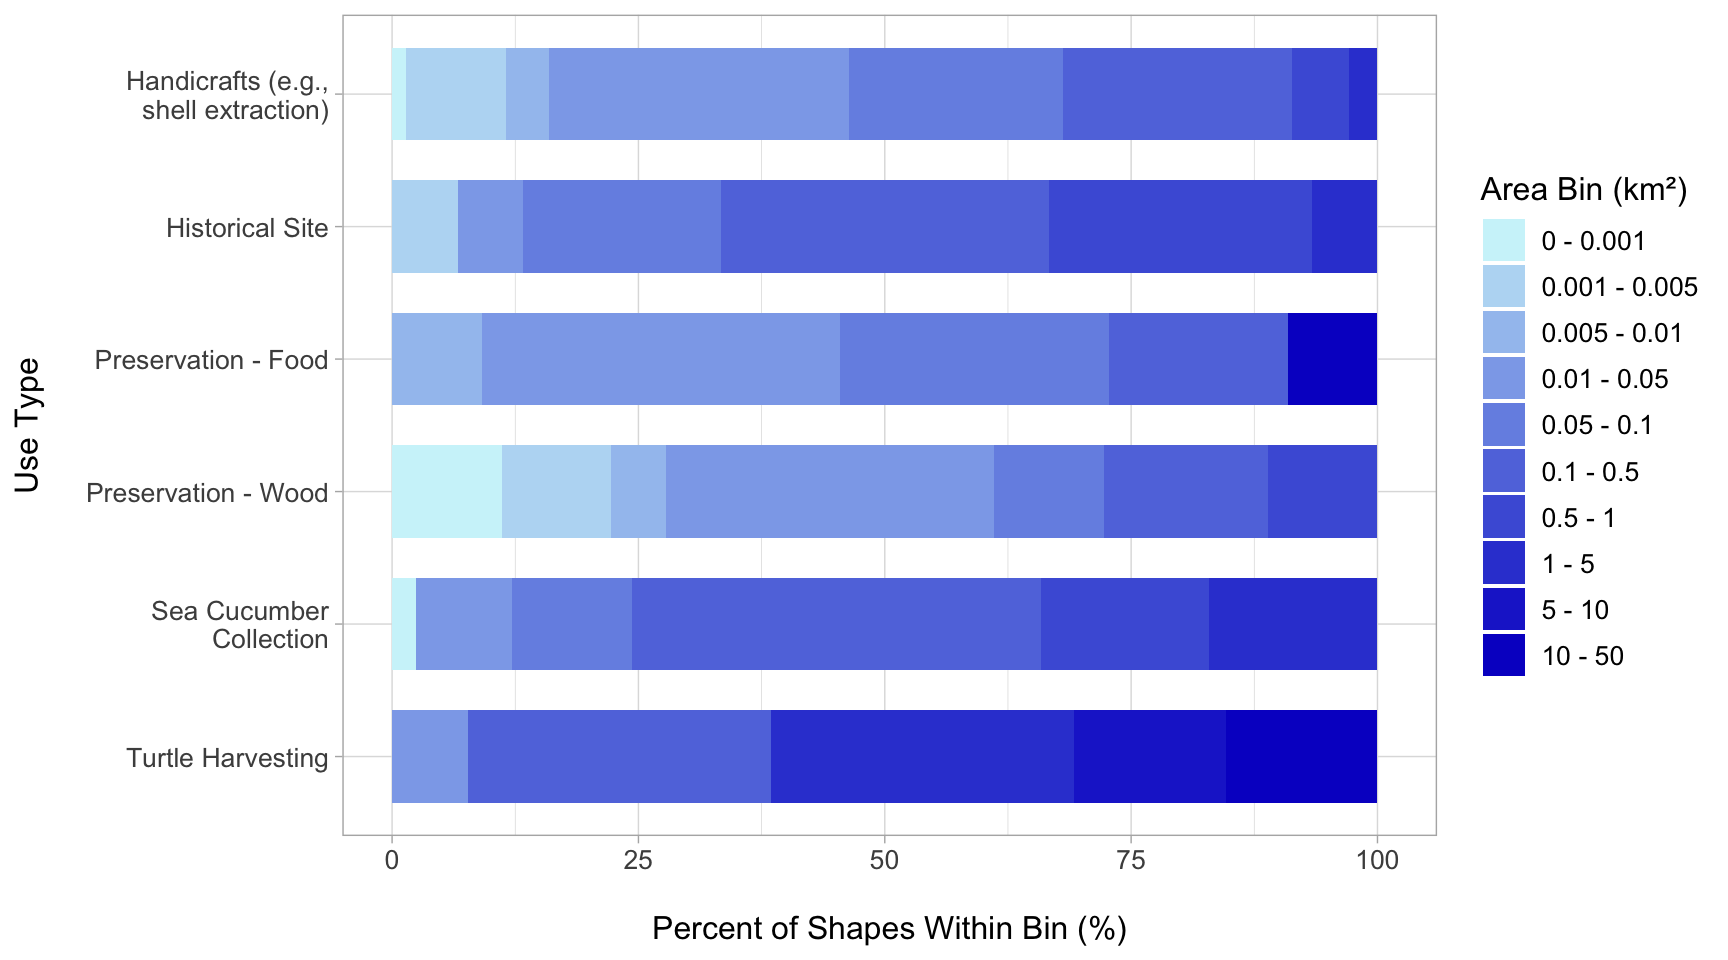
Area Bins
Percent of shapes in each use type that fall within the given area bins
Value by Use Type
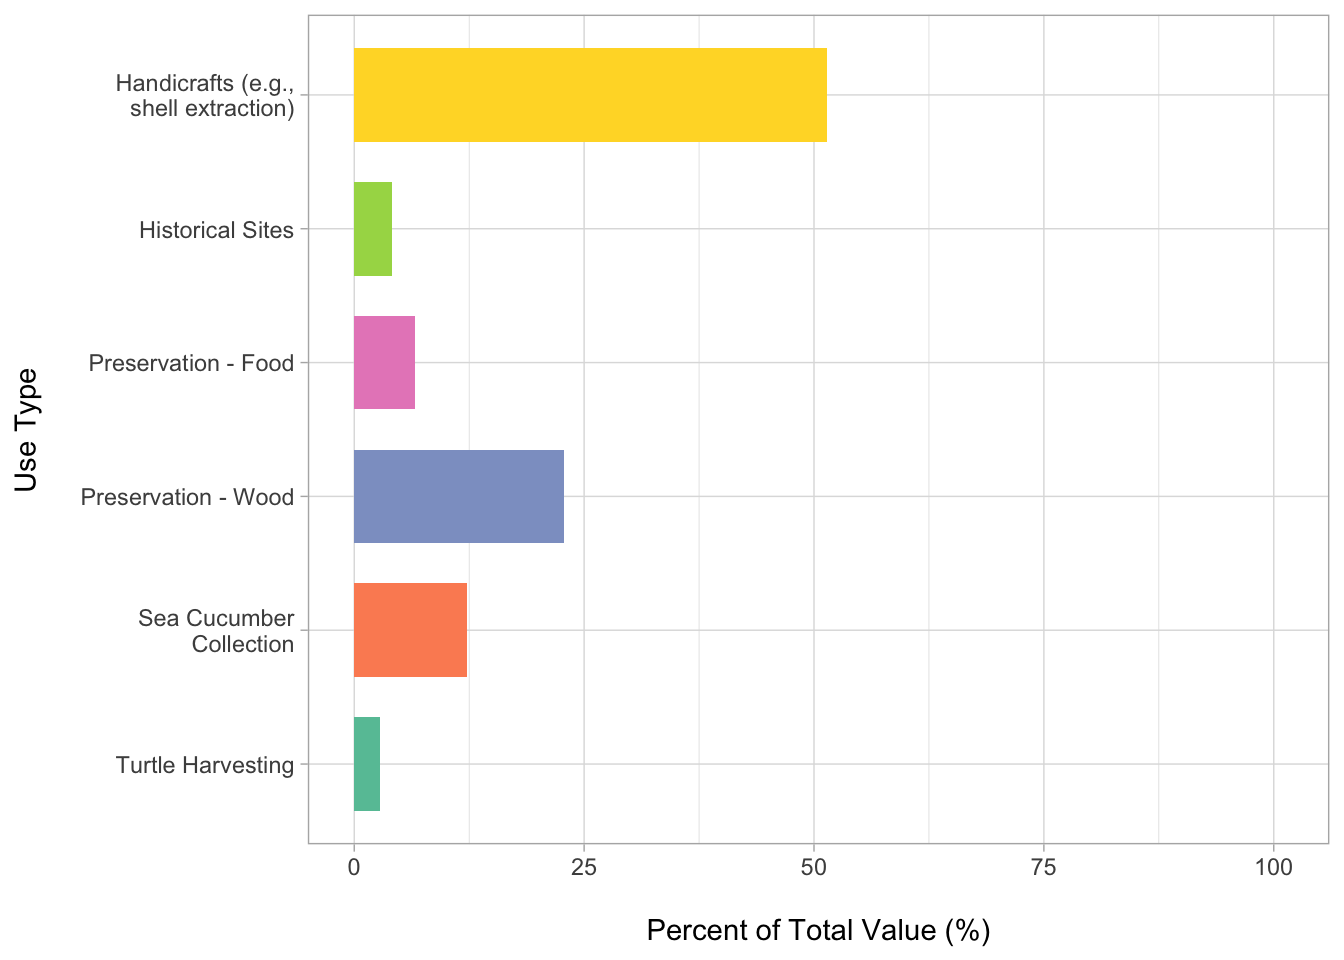
Percent Total Value
Percent of value each use type contributes to the total value of the Cultural Use heatmap
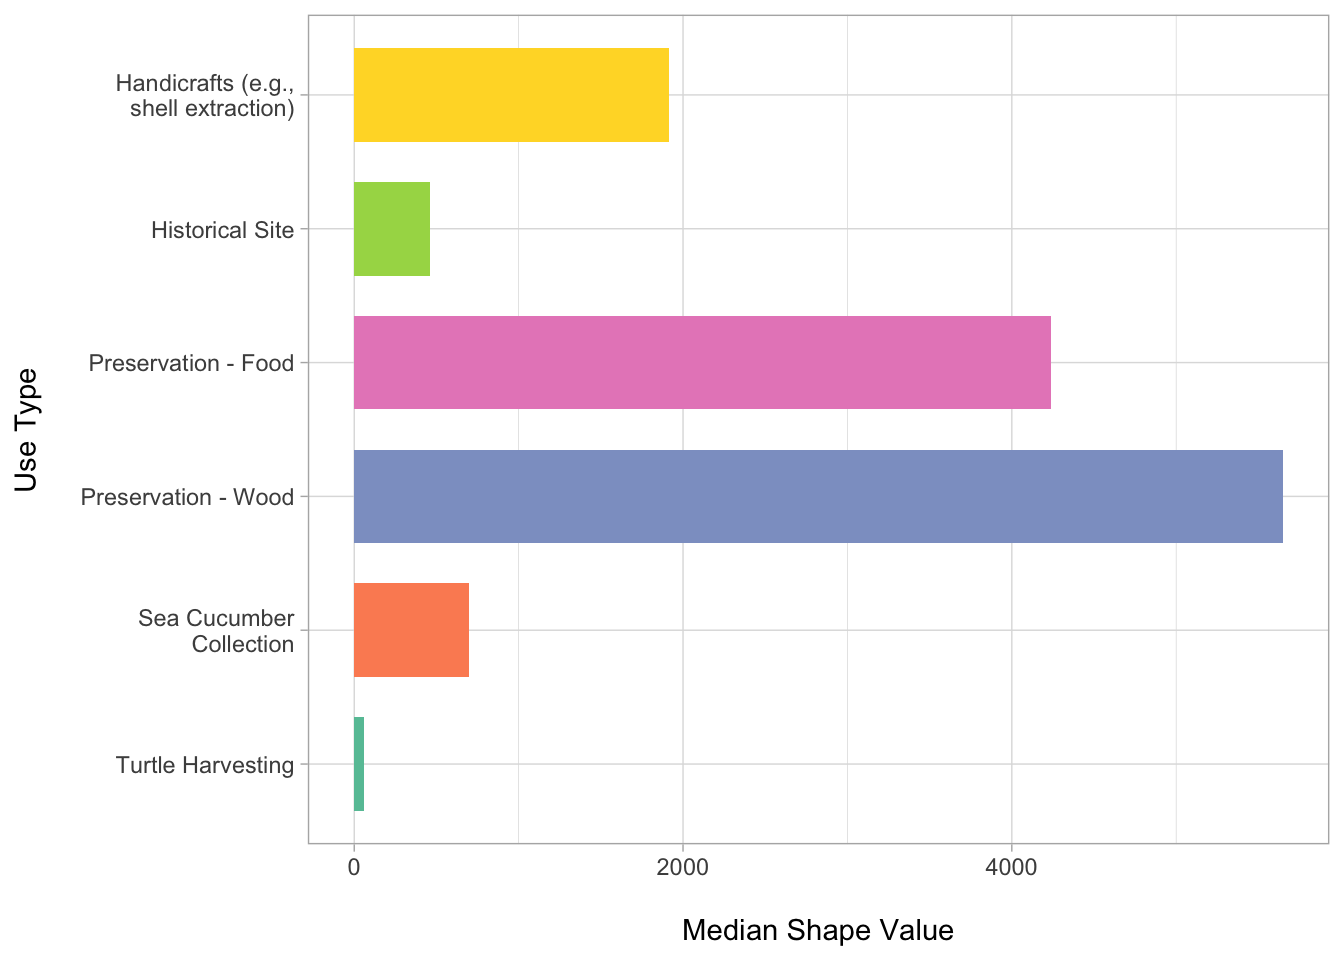
Median Value Per Shape
Median value of shapes within each use type - median was used instead of mean to reduce skewing from outliers