Belize OUS Gender Summary
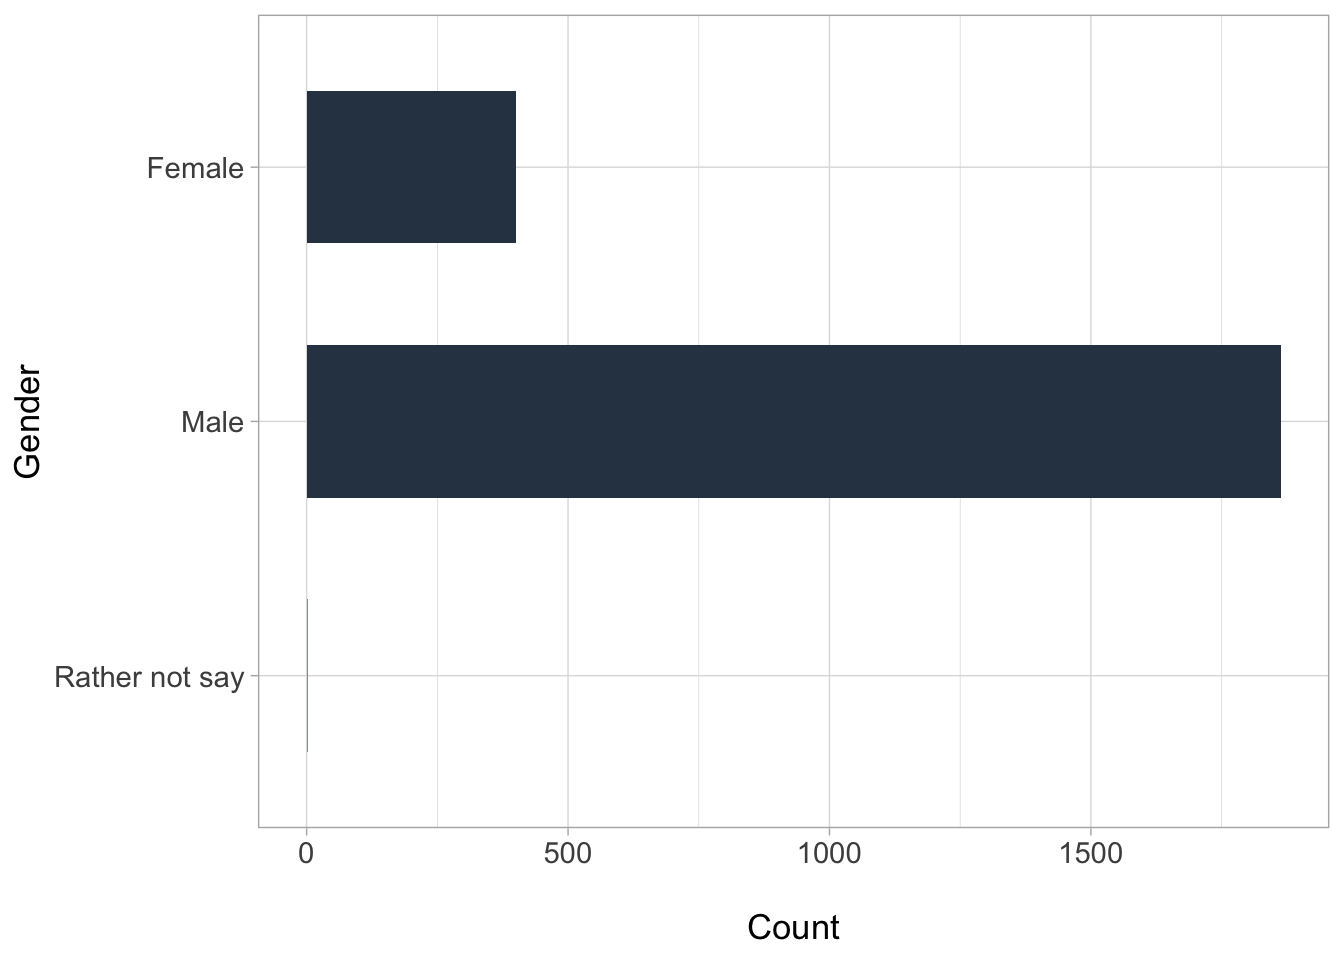
Participants by Gender
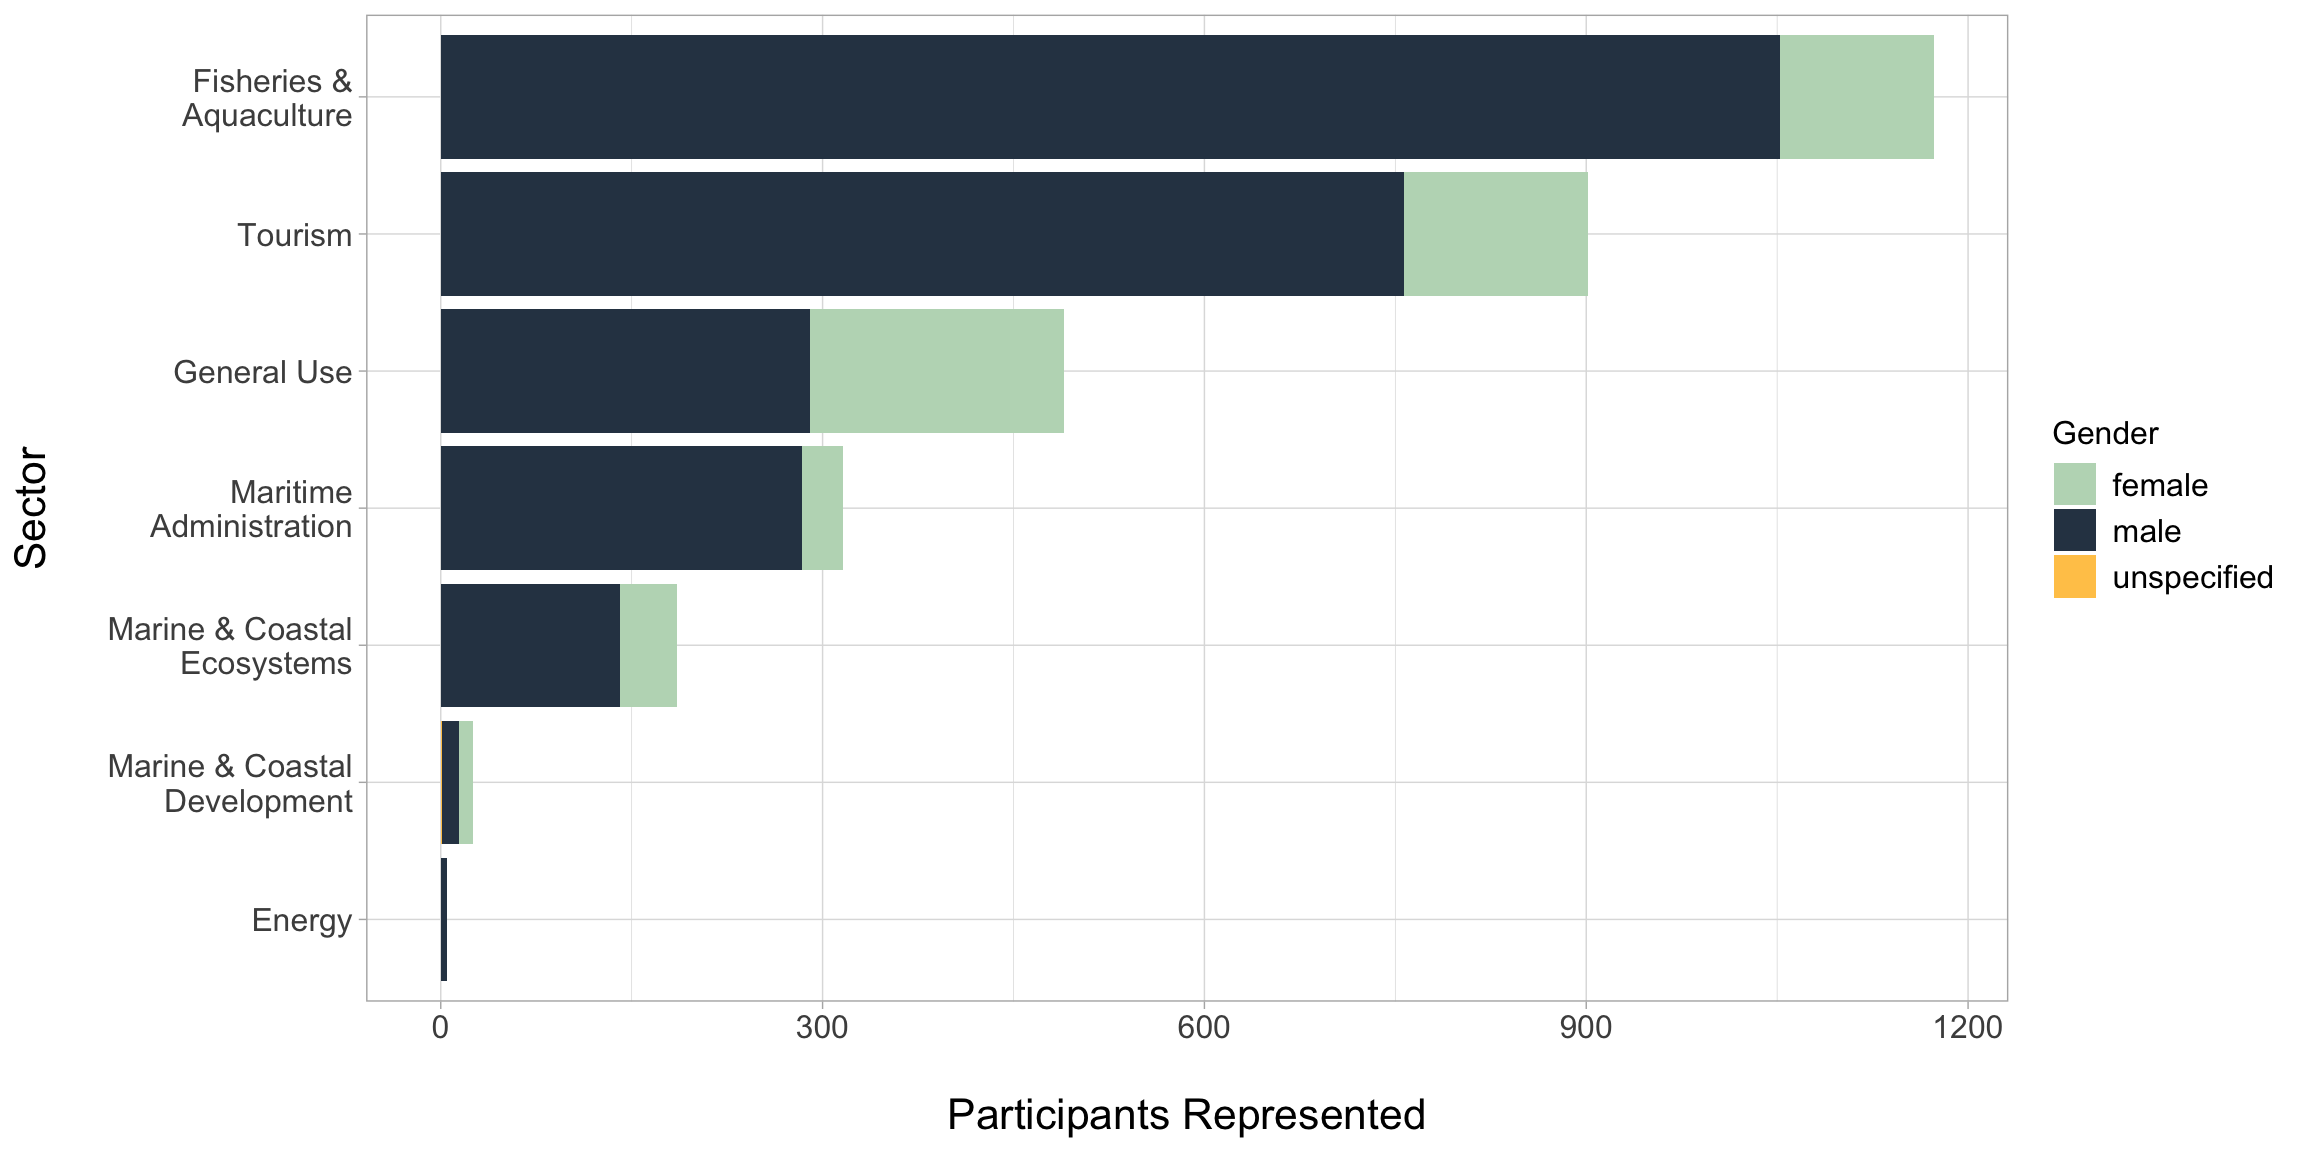
Participants by Gender and Sector
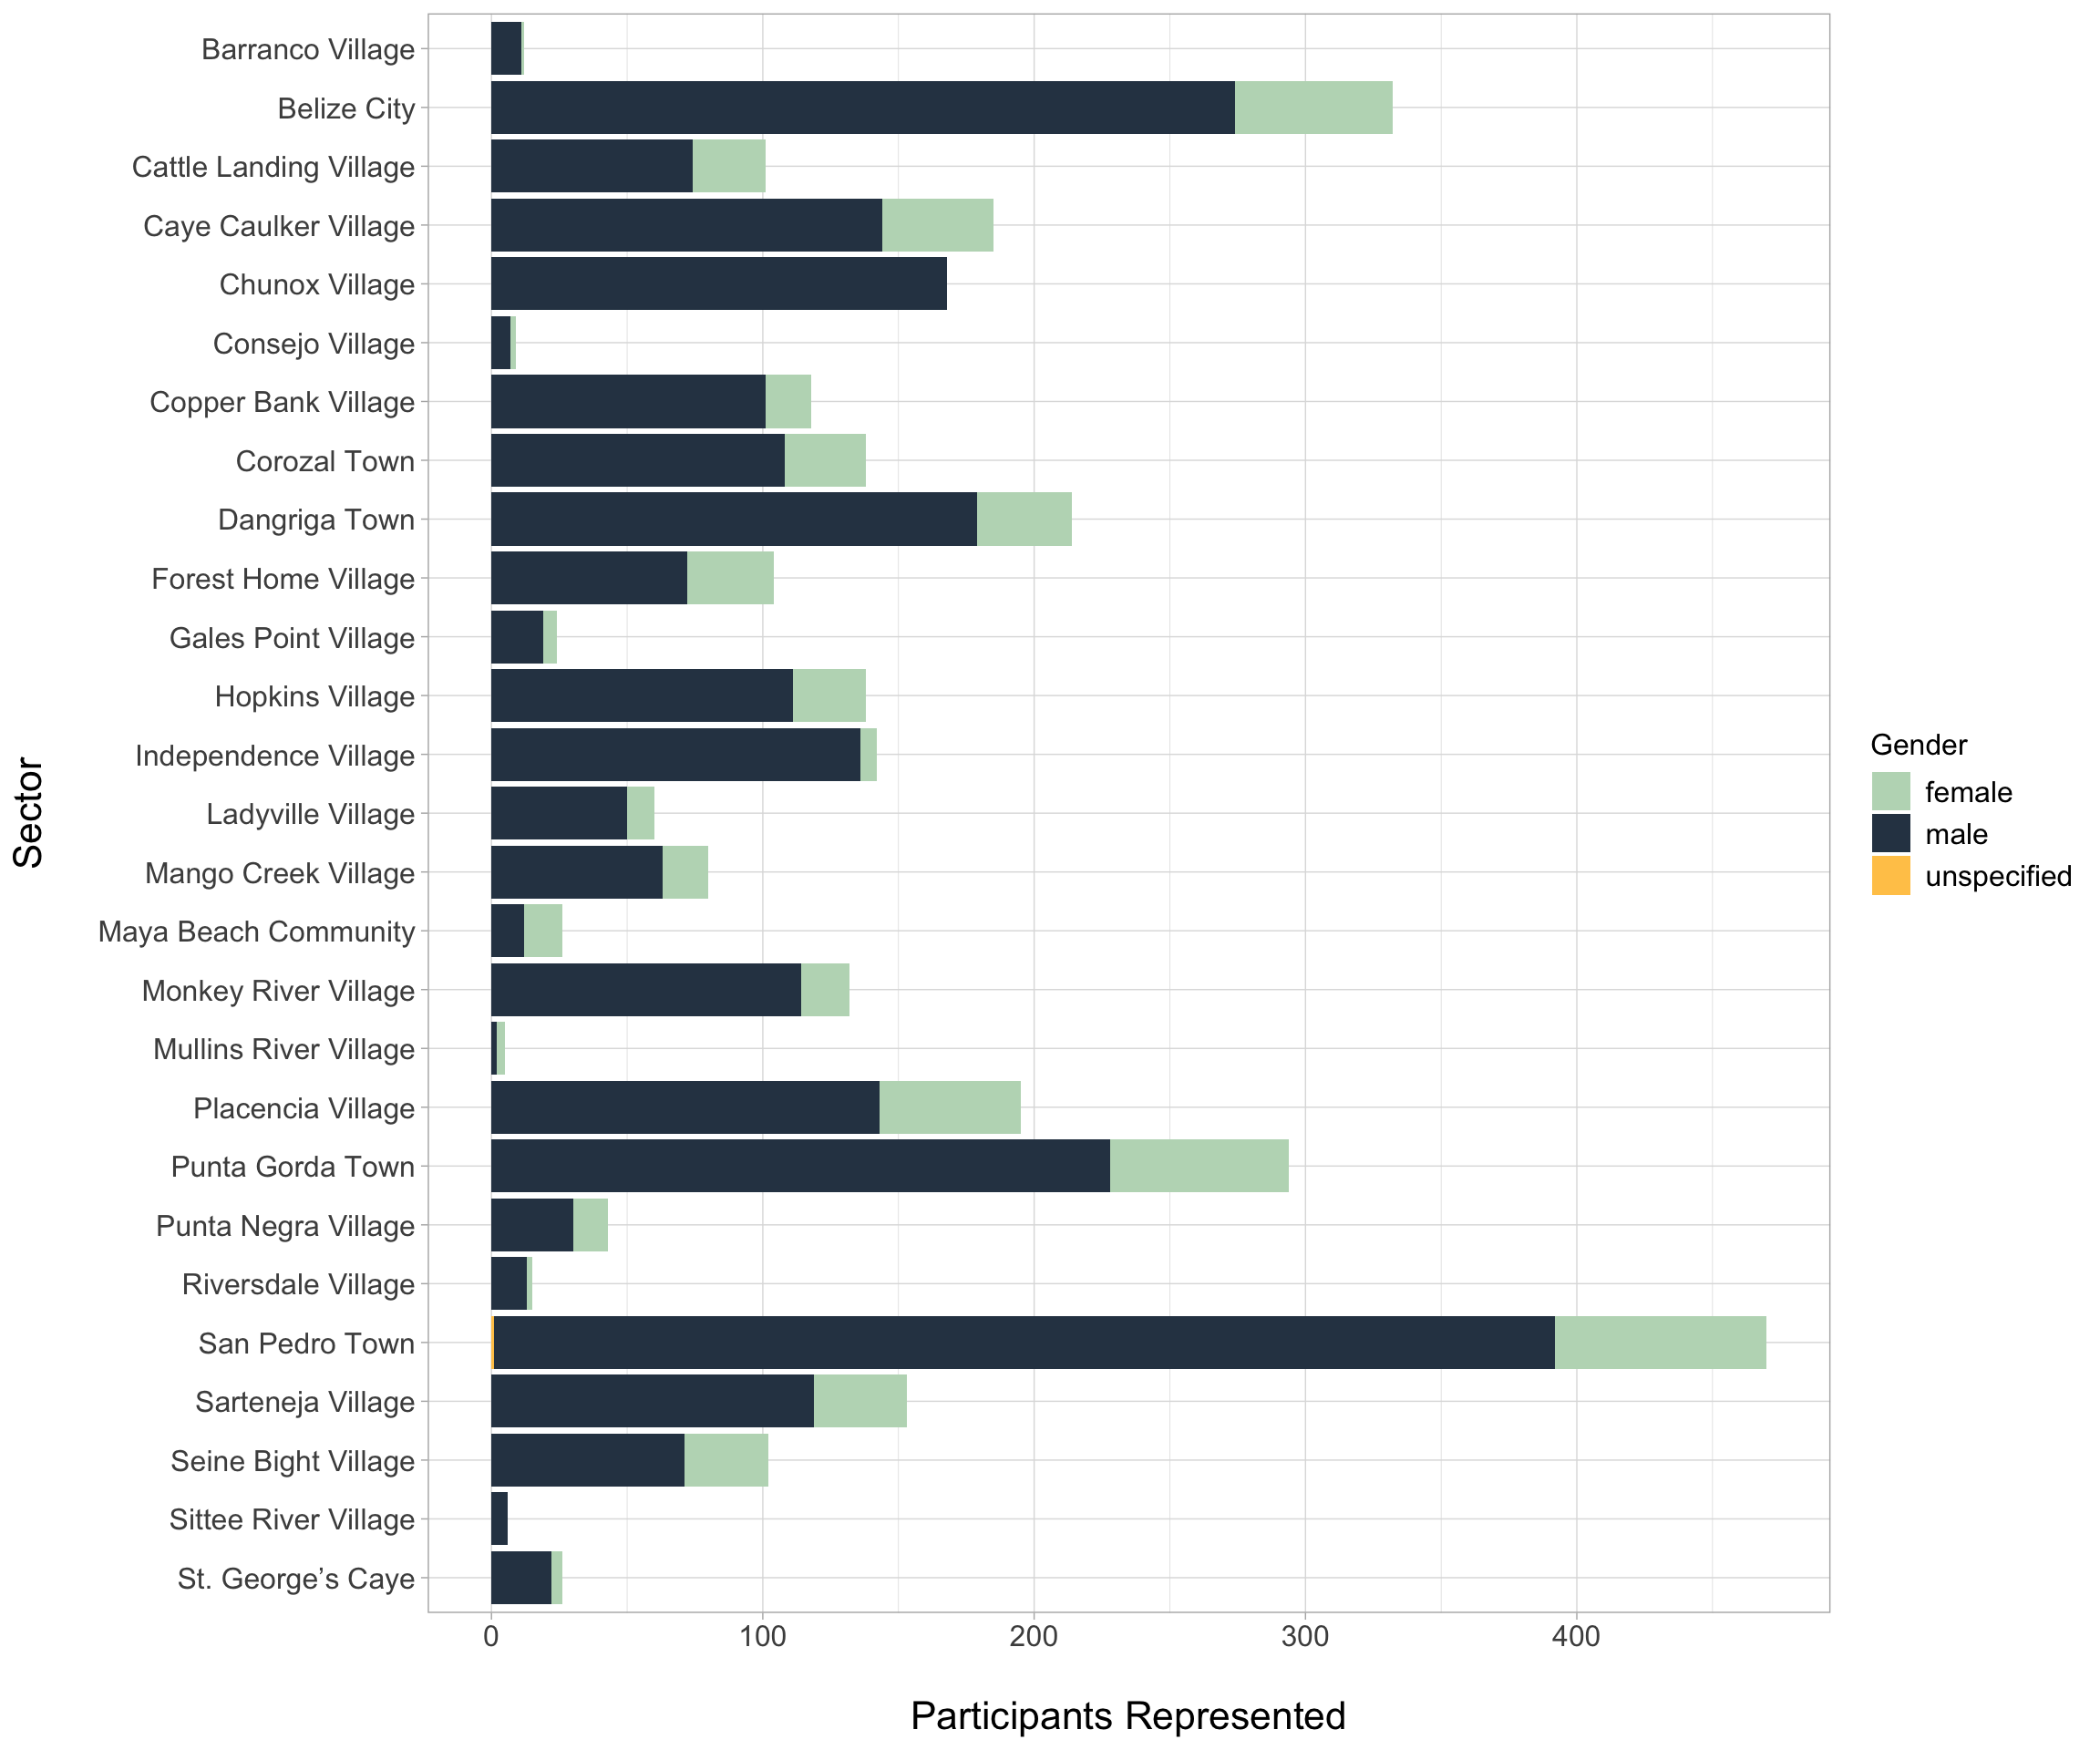
Gender by Community
Shapes by Gender
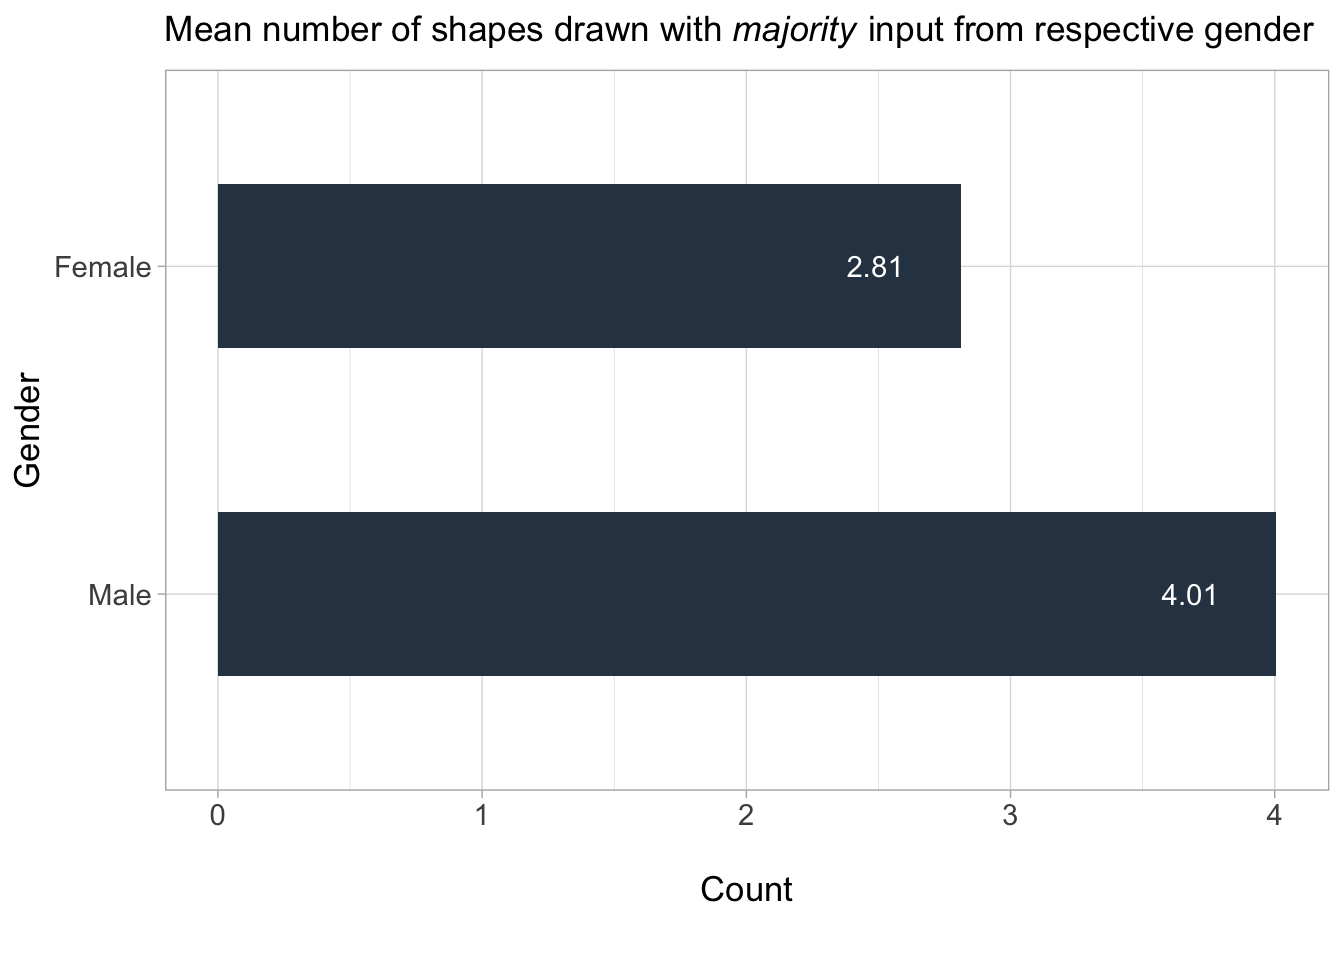
Mean number of Shapes Drawn

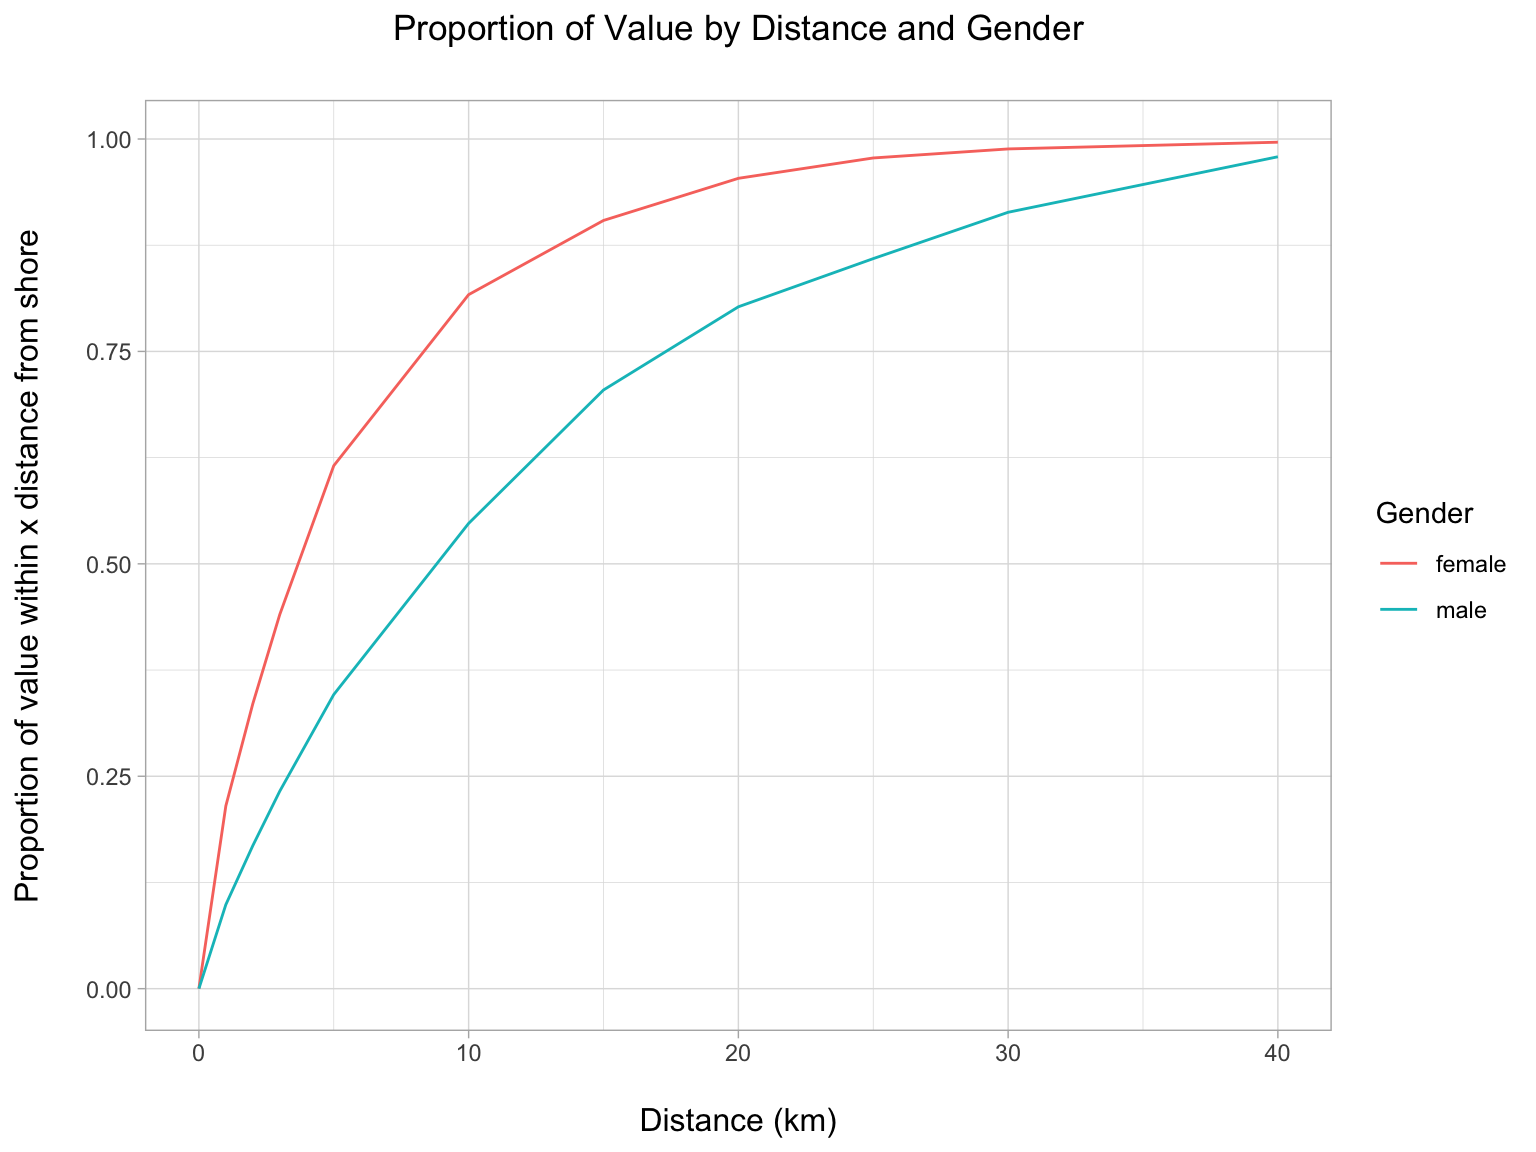
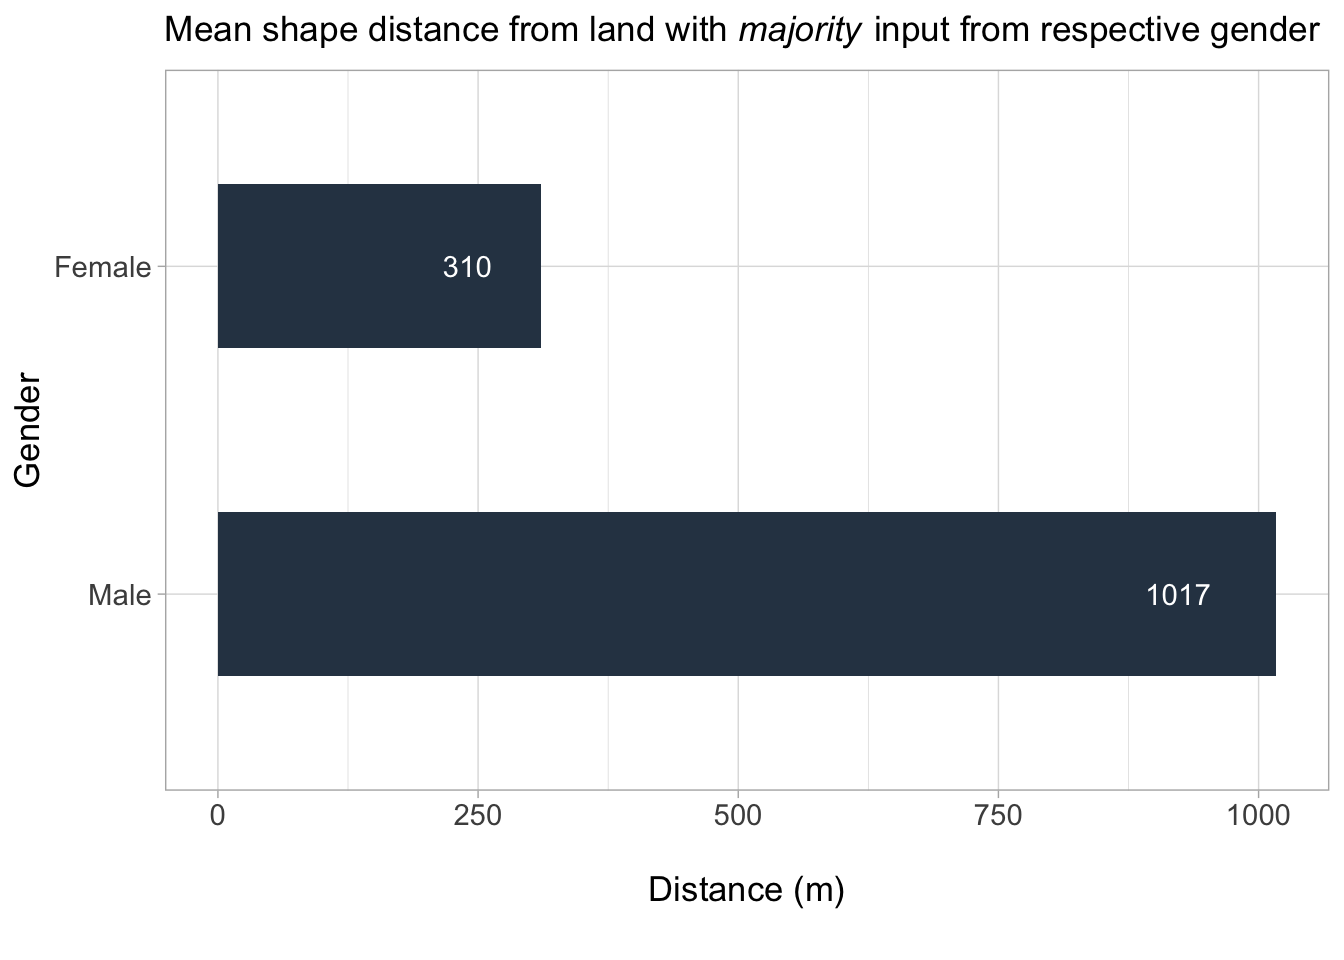
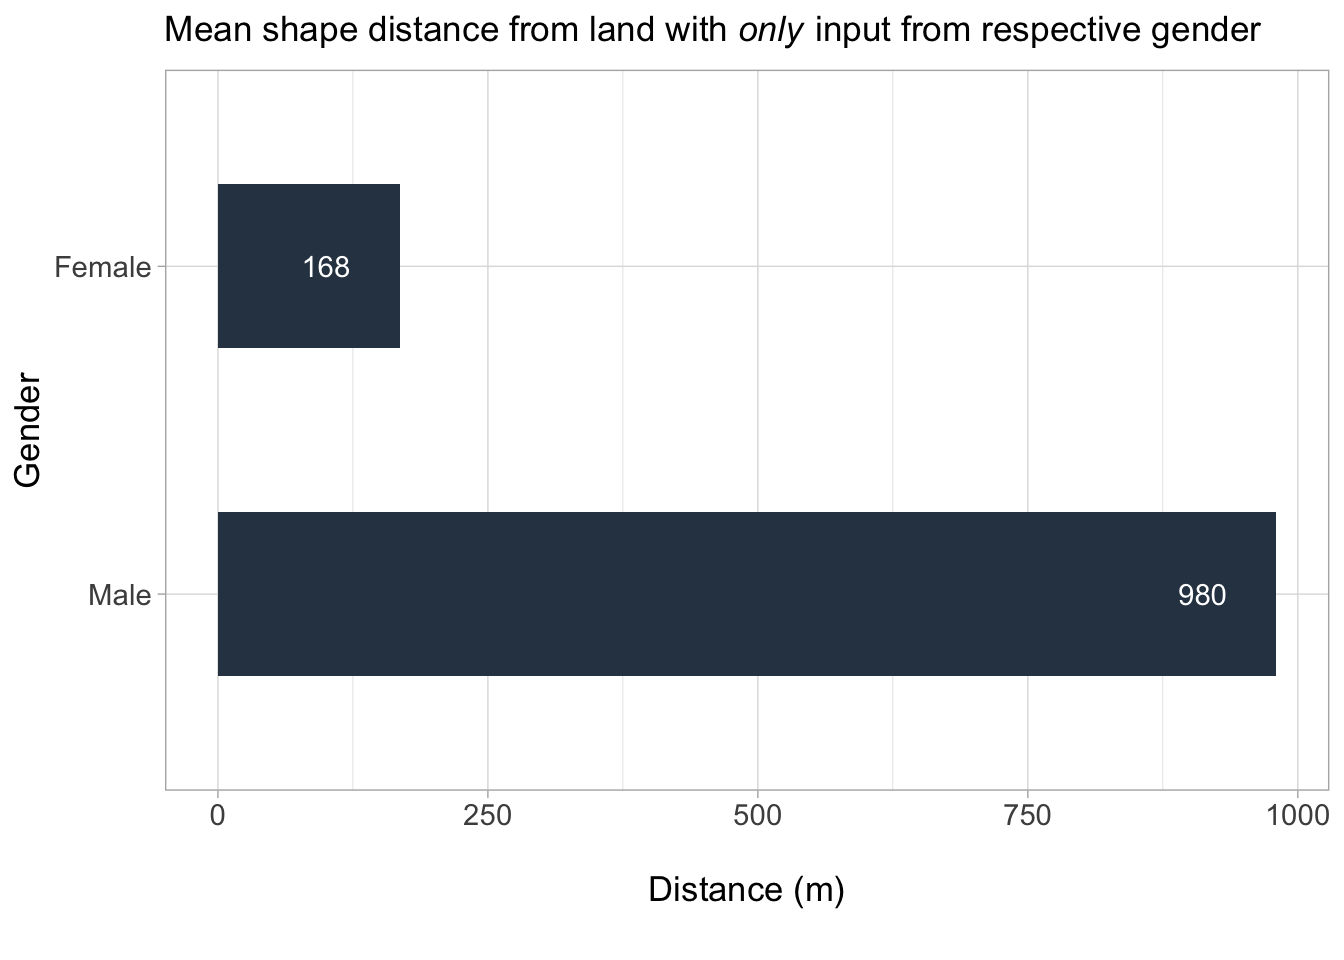
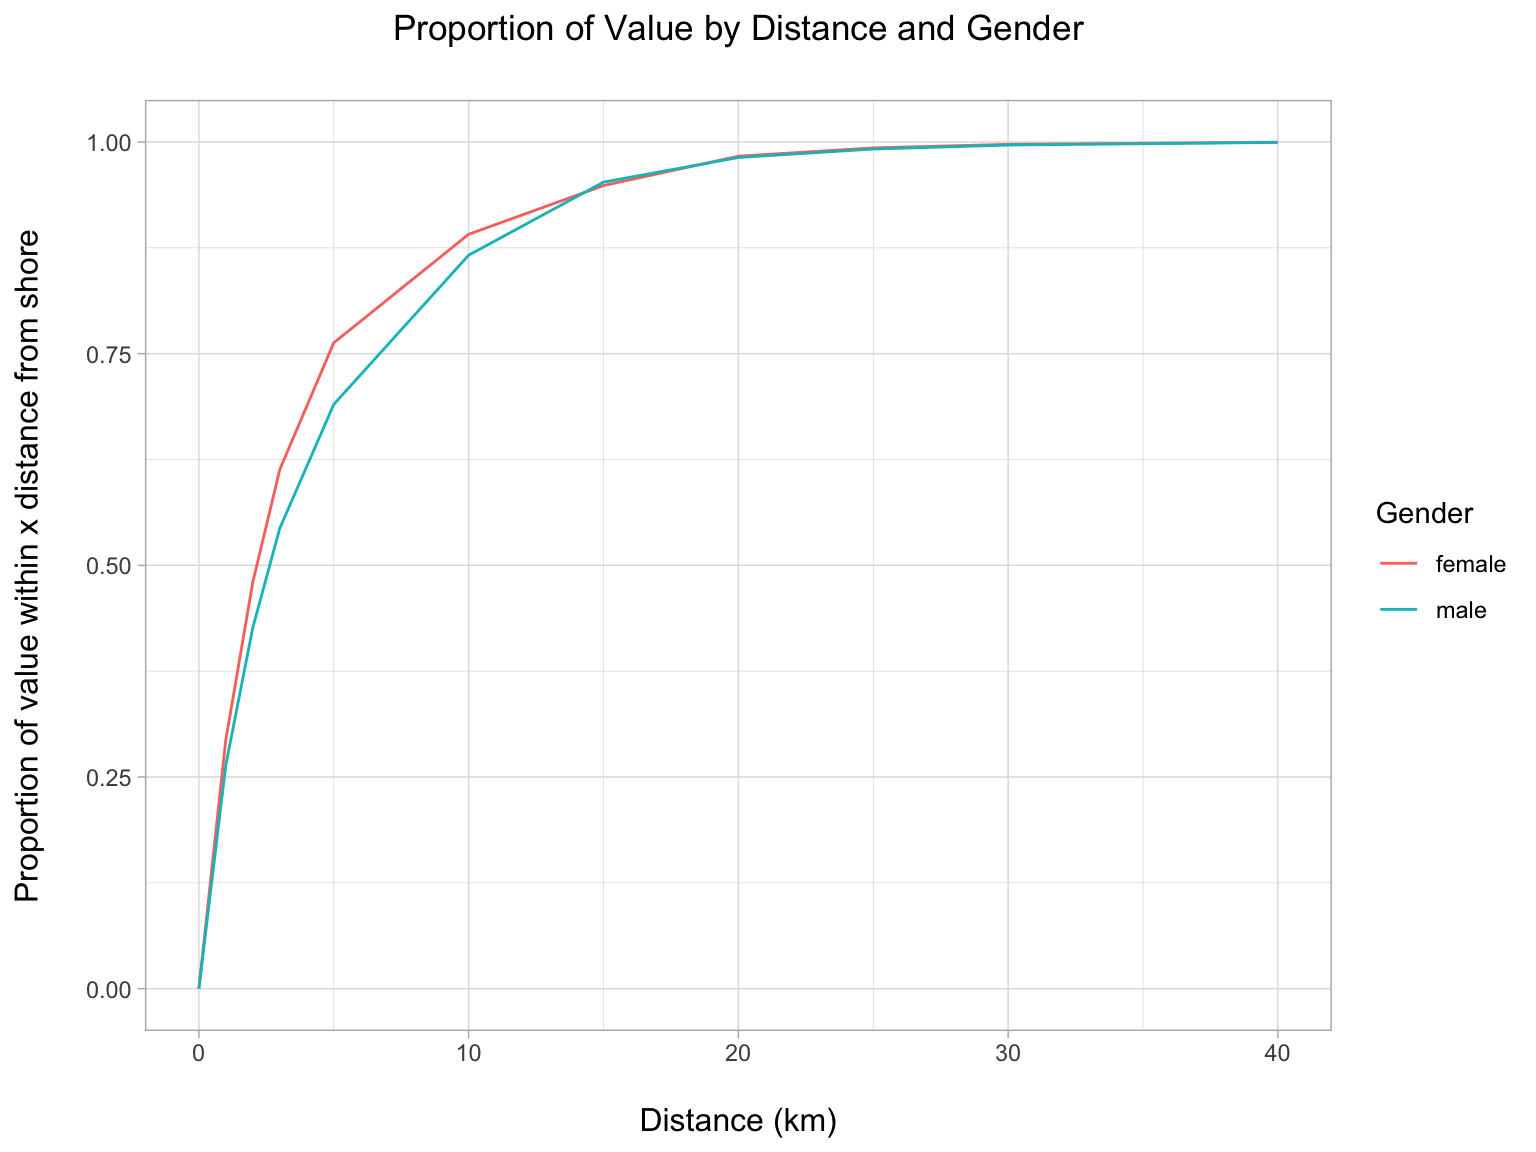
Distance from land
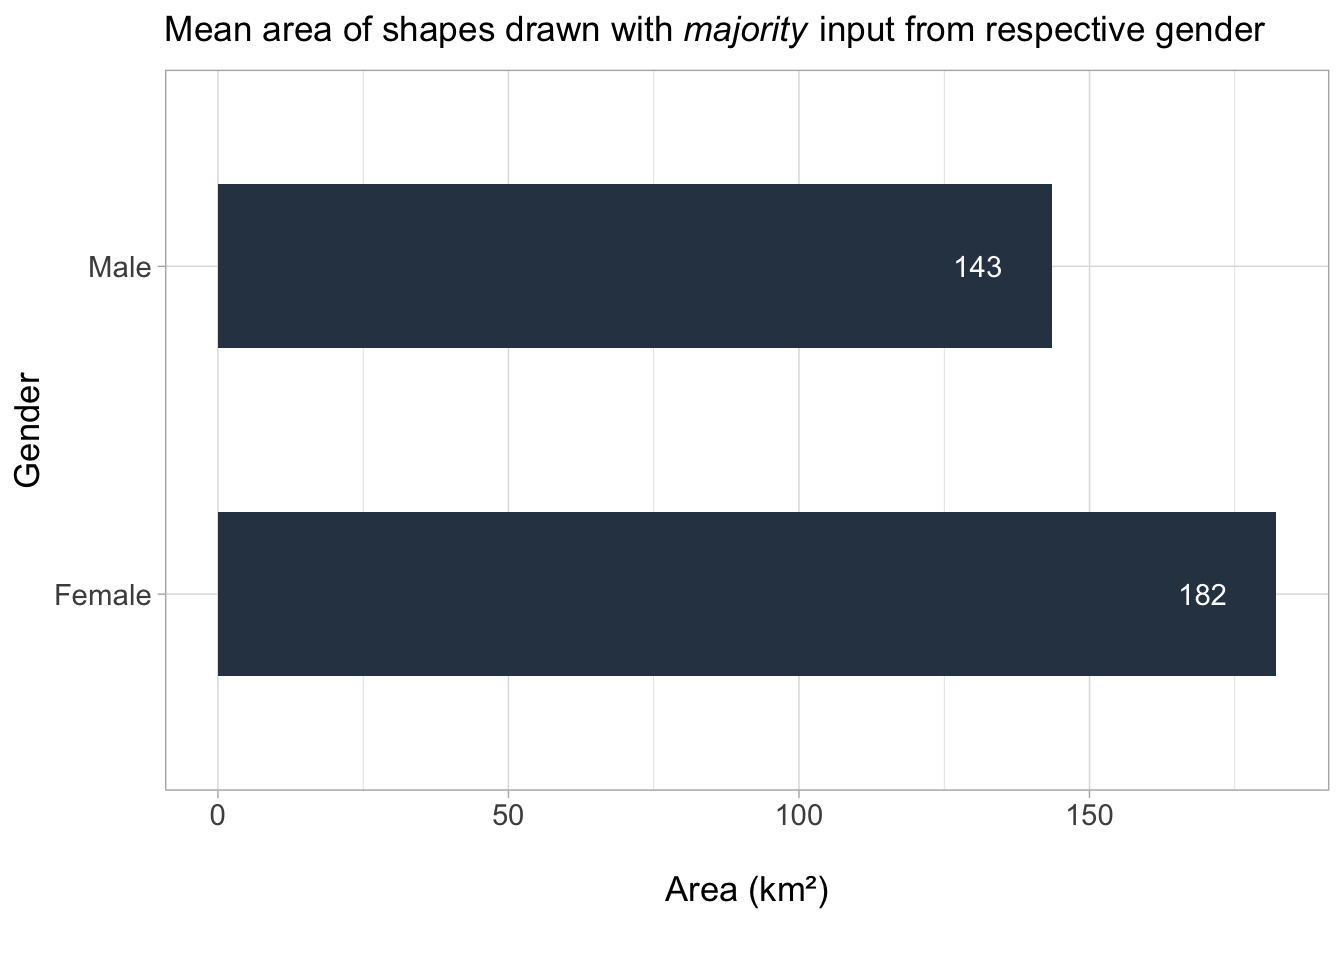
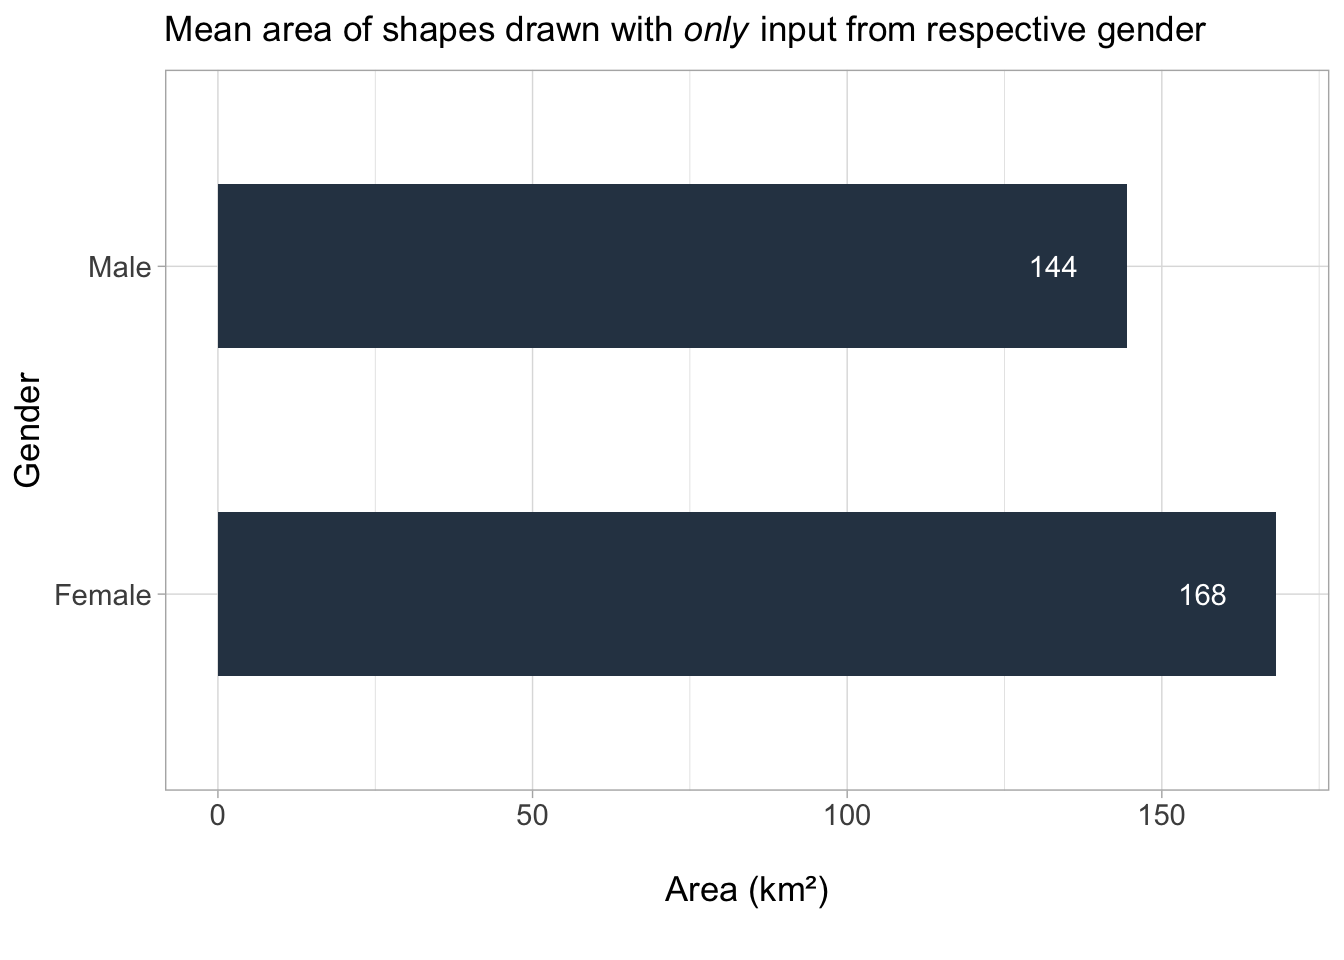
Shape size
Value by Distance
All responses
This plot was created using all responses that the respective genders were represented in (regardless of representation by the other gender). Values were winsorized at the 98th percentile to reduce skewing from a small number of extremely high value pixels.
Gender exclusive responses
This plot was created using responses with only female or only male respondents. Values were similarly winsorized at the 98th percentile.